Chat2CSV
CSV to chart conversion using natural language commands.
About Chat2CSV
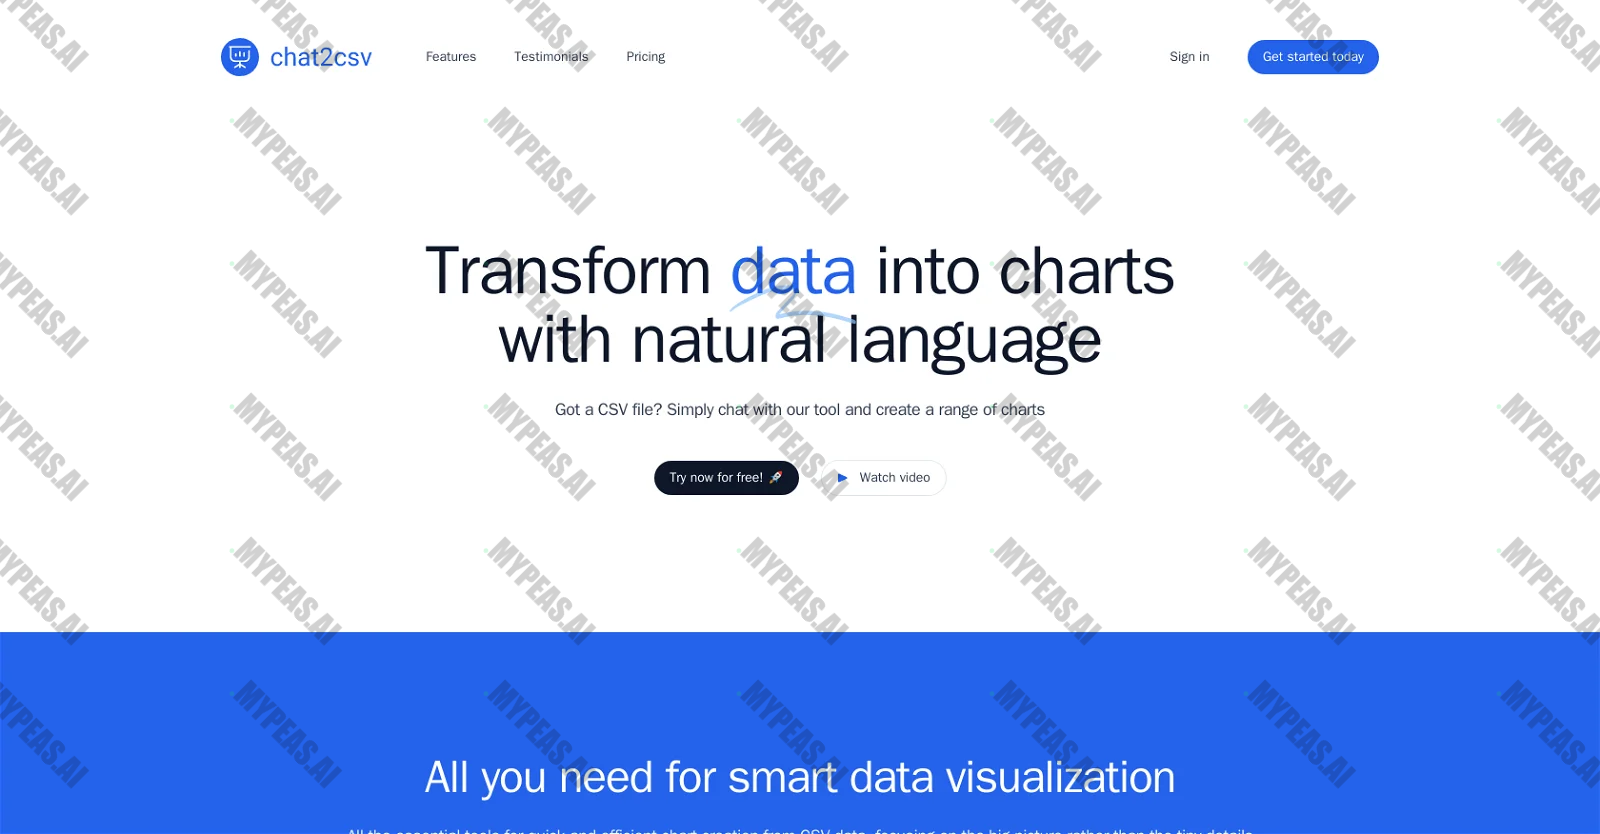
"VisualizeCSV: A Creative Data Transformation Tool" VisualizeCSV is an innovative tool designed for transforming CSV files into interactive charts using simple natural language commands. The platform focuses on user-friendly features, eliminating the need for intricate coding or scripting. Users can easily input commands in plain English, like "show a bar chart of sales by region," and watch as the tool generates the desired visual representation. Powered by AI technology, VisualizeCSV not only understands user instructions but also offers recommendations on the most suitable chart types for efficient data analysis, enhancing insights and decision-making. With a diverse range of chart options available, including pie charts, scatter plots, line graphs, and bar charts, users can effectively visualize their data in a variety of ways. Security is a top priority for VisualizeCSV. The platform's servers only handle metadata, ensuring that users' actual data remains secure and private on their end. Free access to the platform is currently offered, allowing users to explore its capabilities with minimal restrictions. A premium plan is in the works, which will provide enhanced query limits, support for multiple CSV files, larger file size allowances, and cloud storage options. Users have commended VisualizeCSV for its user-friendly interface and AI assistant, which offers valuable suggestions for chart types, making data analysis an enjoyable and seamless experience.










Track the Impact of Your AI Usage
Document your productivity gains and build your AI portfolio for performance reviews
Start Tracking Free